Updated: September 03, 2026
Learning how to read a forex trading chart is one of the first skills beginners should develop before considering a live forex trade. Charts can look complicated at first, but once you understand candlesticks, timeframes, trends, support and resistance, and basic indicators, they become much easier to interpret.
In this beginner-friendly guide, we'll explain how forex charts work, how to read candlesticks, how to identify trends, and how to use basic technical-analysis tools without making your chart unnecessarily complicated.
Risk Warning: Forex trading involves substantial risk, especially when leverage is used. You can lose some or all of your trading capital. This article is for educational purposes only and is not financial or investment advice.
What Is a Forex Trading Chart?
A forex trading chart is a visual representation of how the price of a currency pair changes over time.
For example, EUR/USD compares the euro with the U.S. dollar. If EUR/USD is quoted at 1.1000, it means that one euro is worth approximately 1.10 U.S. dollars.
A typical forex chart contains:
- Price information
- Time information
- Candlesticks or another chart type
- Trading volume or related market information, depending on the platform
- Technical indicators
- Support and resistance levels
- Drawing tools such as trend lines
If you're completely new to forex, first read our beginner guide:
What Is Forex Trading? A Beginner's Simple Guide
Step 1: Understand the Currency Pair
Before reading a chart, identify the currency pair you're analyzing.
For example:
EUR/USD
- EUR: Base currency
- USD: Quote currency
If EUR/USD is 1.1000, one euro is worth approximately 1.10 U.S. dollars.
Forex pairs are generally divided into major, minor and exotic currency pairs. Beginners often start by studying highly traded major pairs because they tend to have greater liquidity.
Learn more here:
How Forex Currency Pairs Work: A Simple Beginner Guide
Step 2: Learn How Candlestick Charts Work
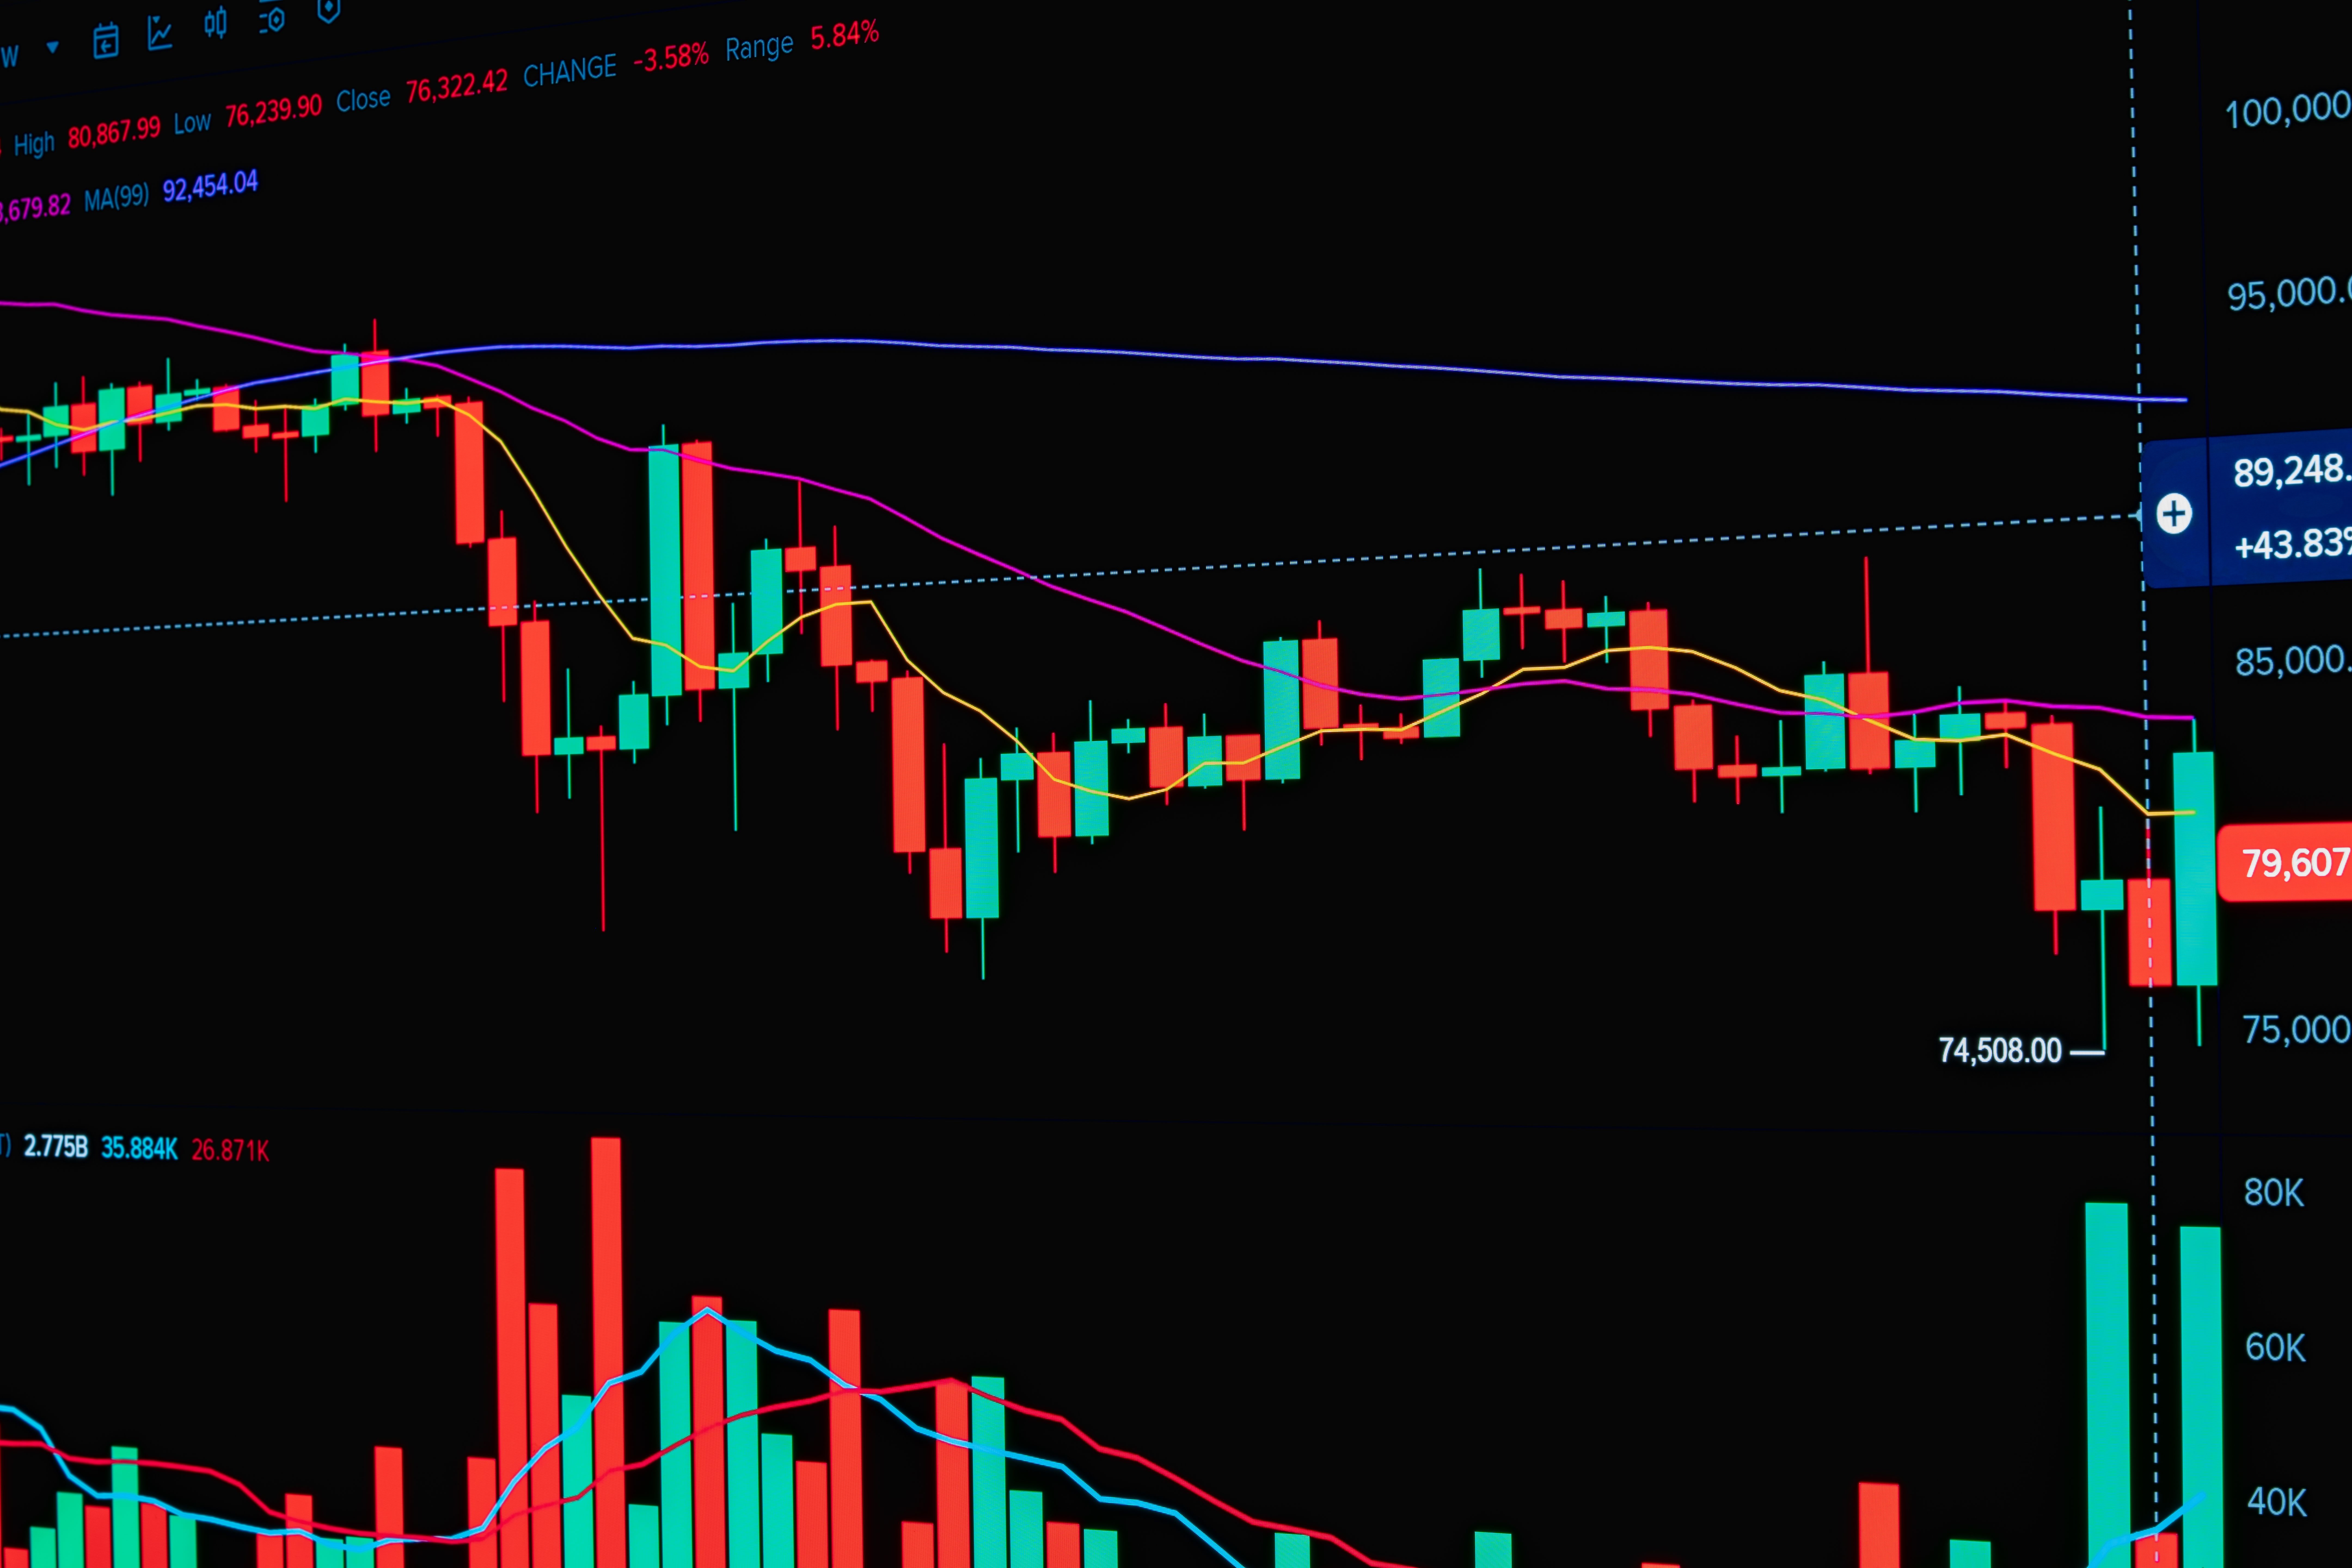
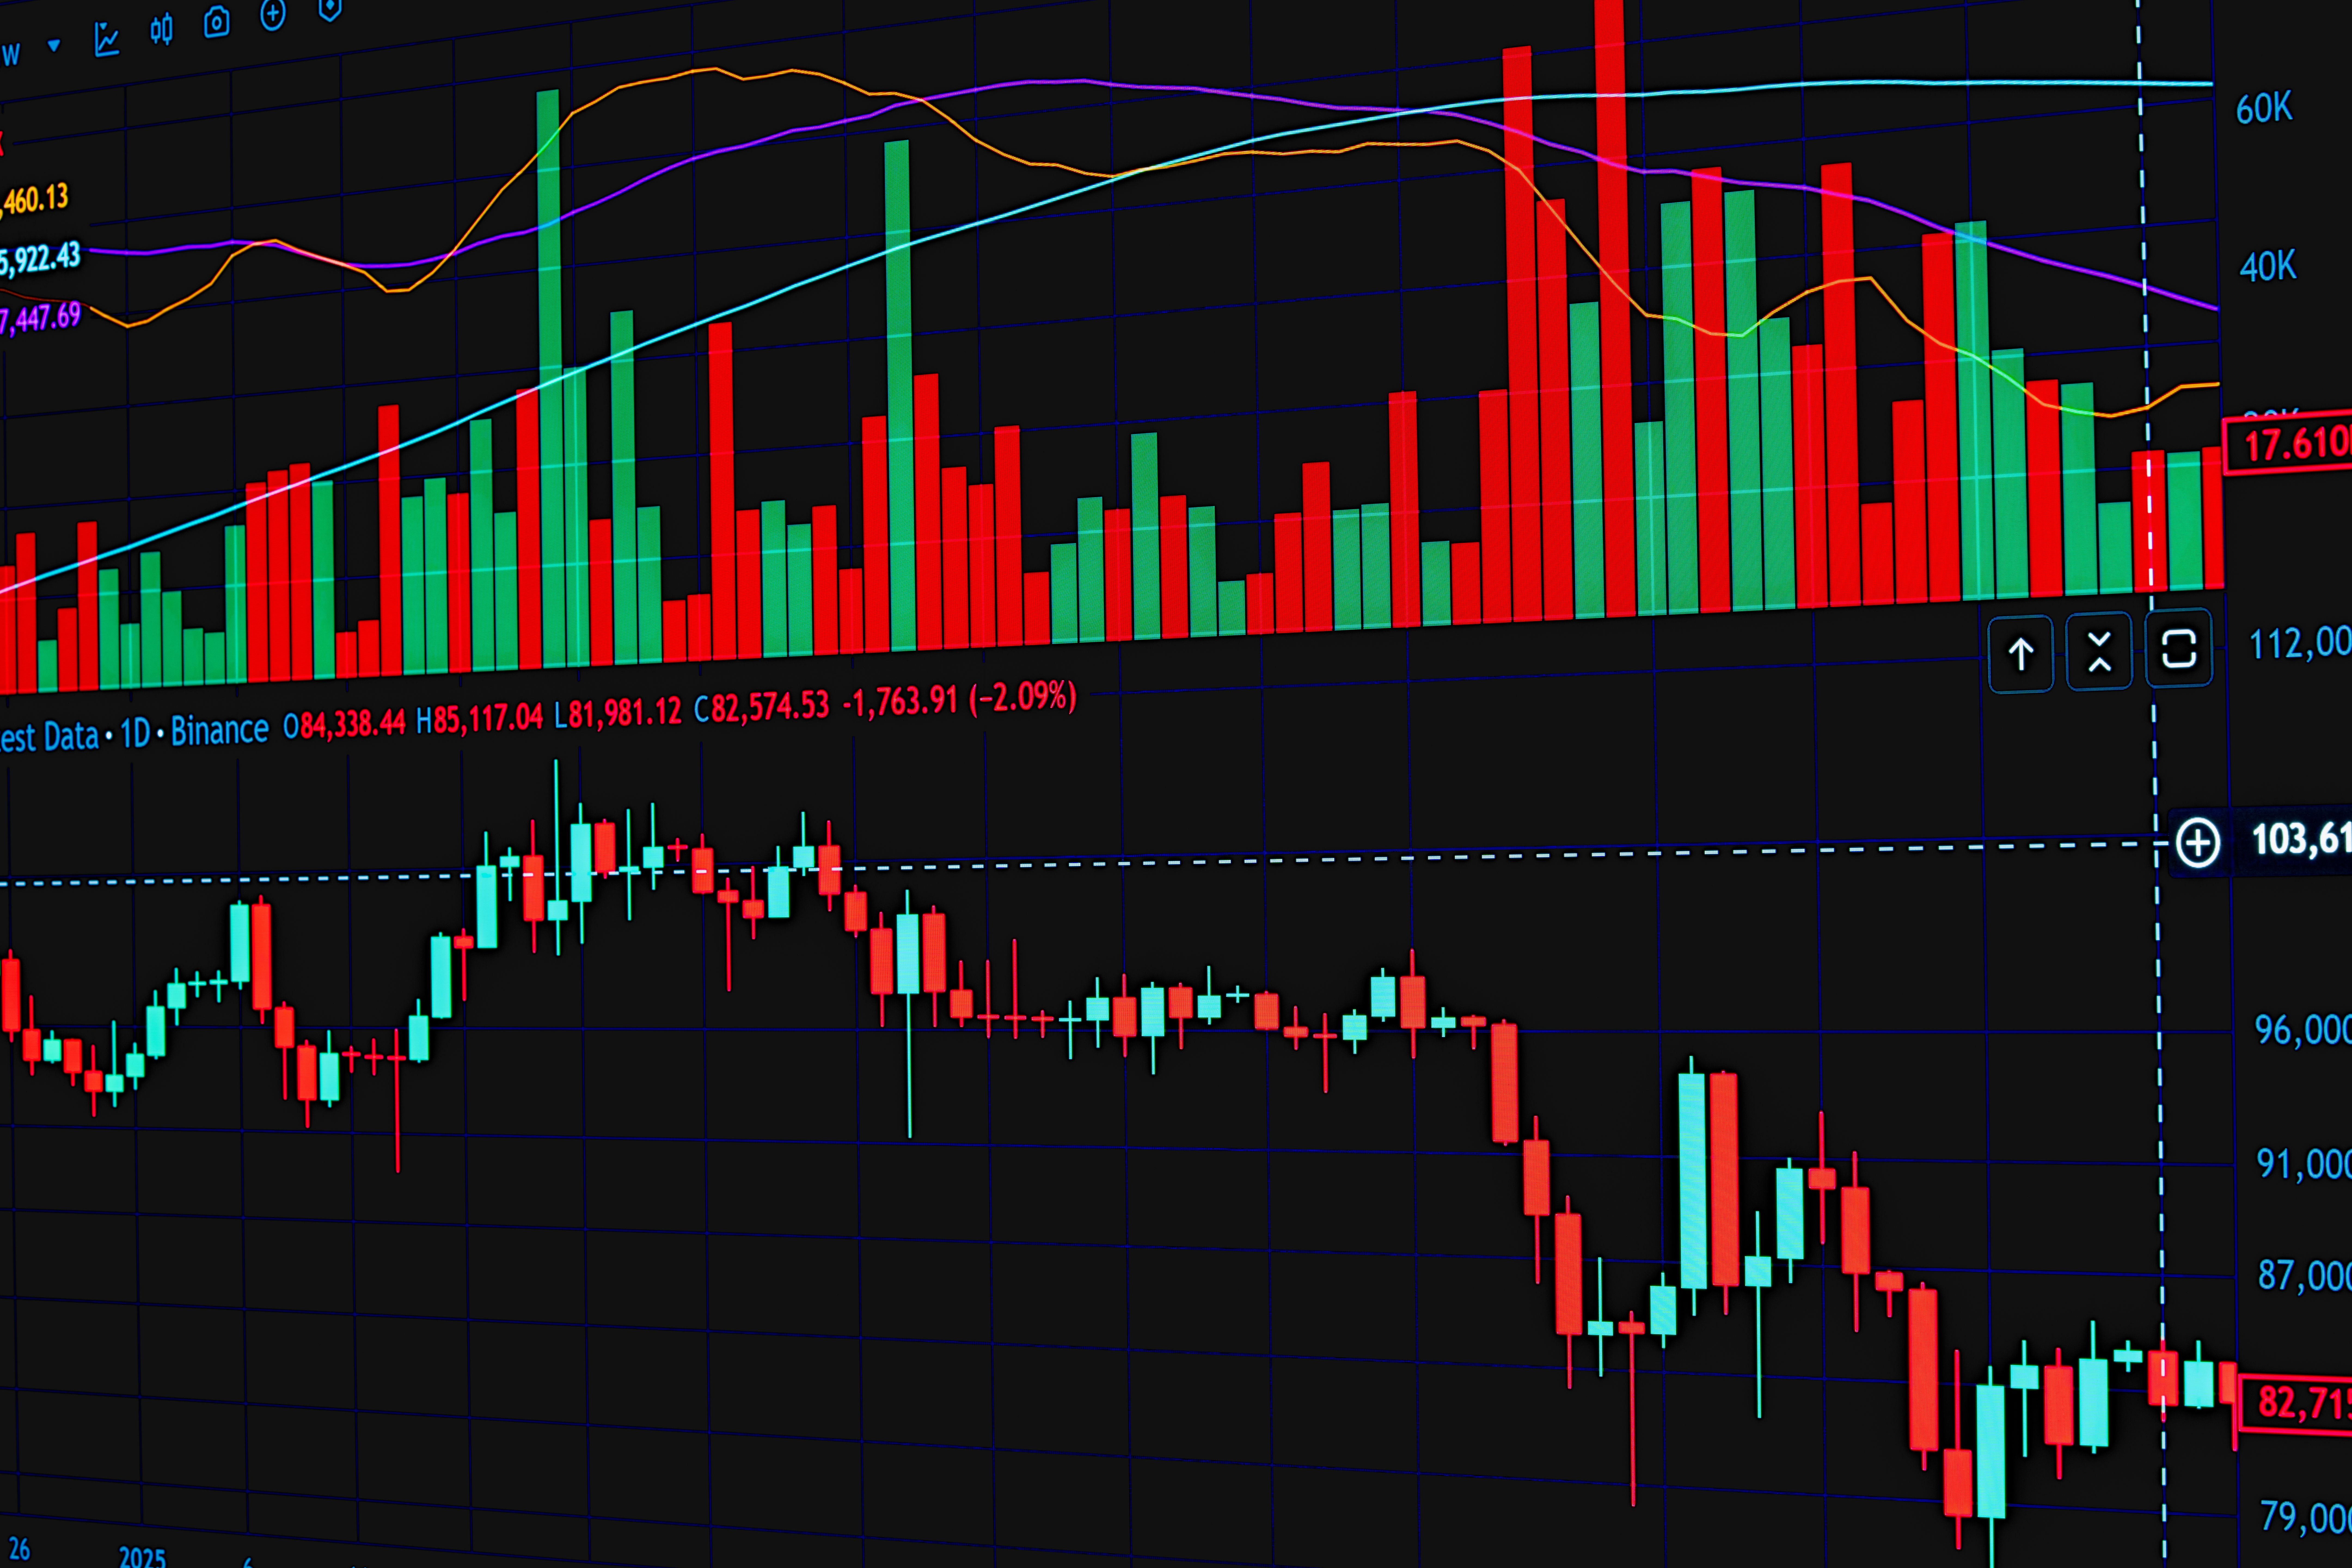
Candlestick charts are widely used by traders because each candle provides several pieces of price information.
Every candle generally shows four important prices:
- Open: The price at the beginning of the selected period
- High: The highest price reached
- Low: The lowest price reached
- Close: The price at the end of the selected period
These four values are commonly called OHLC.
Bullish Candlestick
A bullish candle closes above its opening price. It indicates that price increased during that particular period.
Bearish Candlestick
A bearish candle closes below its opening price. It indicates that price decreased during that particular period.
Understanding the Candle Body and Wicks
The thick part of the candle is called the body. The thin lines above and below the body are called wicks, tails or shadows.
- The upper wick shows how high price moved during that period.
- The lower wick shows how low price moved.
- The body shows the relationship between the opening and closing prices.
For example, if EUR/USD opens at 1.1000, reaches 1.1050, falls to 1.0980 and closes at 1.1030, the candle contains all four of those prices.
Step 3: Choose a Forex Chart Timeframe
The timeframe determines how much time each candle represents.
Common forex timeframes include:
- 1 minute
- 5 minutes
- 15 minutes
- 30 minutes
- 1 hour
- 4 hours
- Daily
- Weekly
- Monthly
For example, on a 1-hour chart, each candle represents one hour of price activity. On a daily chart, each candle represents one trading day.
Beginners may find 1-hour, 4-hour or daily charts easier to study than extremely short timeframes because short-term charts can contain significant market noise.
Step 4: Identify the Market Trend
One of the first questions to ask when looking at a forex chart is:
Is price generally moving upward, downward or sideways?
Uptrend
An uptrend generally contains a sequence of higher highs and higher lows.
Higher highs + higher lows = potential upward trend.
Downtrend
A downtrend generally contains lower highs and lower lows.
Lower highs + lower lows = potential downward trend.
Sideways Market
A sideways or ranging market occurs when price moves within a relatively defined area without establishing a clear long-term direction.
Step 5: Understand Support and Resistance
Support and resistance are two important concepts in technical analysis.
What Is Support?
Support is a price area where buying interest has previously appeared and downward movement has slowed or reversed.
For example, if EUR/USD repeatedly falls toward 1.0800 and then rebounds, traders may watch the area around 1.0800 as potential support.
What Is Resistance?
Resistance is a price area where upward movement has previously encountered selling pressure.
If EUR/USD repeatedly approaches 1.1000 but struggles to move above that area, traders may monitor 1.1000 as potential resistance.
Support and resistance are not guaranteed barriers. Price can break through either level.
Step 6: Learn Basic Candlestick Patterns
After understanding individual candles, beginners can gradually learn common candlestick patterns.
- Doji
- Hammer
- Shooting star
- Bullish engulfing
- Bearish engulfing
- Morning star
- Evening star
A candlestick pattern should not automatically be treated as a buy or sell signal. Its meaning can depend on the surrounding trend, timeframe and price level.
Step 7: Understand Pips, Lots and Spreads
A pip is a commonly used unit for measuring forex price movement.
For many major currency pairs, one pip corresponds to the fourth decimal place.
For example:
EUR/USD: 1.1000 → 1.1010
This represents approximately a 10-pip movement under the standard four-decimal convention.
The exact pip convention can differ for currency pairs such as JPY pairs.
Learn more about pips, lots and spreads here:
What Are Pips, Lots and Spreads in Forex?
What Is the Forex Spread?
The spread is the difference between the bid price and ask price.
For example:
The difference is 0.0002, which is approximately 2 pips for a standard four-decimal currency pair.
Spreads can change according to the currency pair, liquidity and market conditions.
Step 8: Use Technical Indicators Carefully
Trading platforms offer many technical indicators. Beginners should learn what an indicator measures before using it as part of a trading strategy.
Moving Average
A moving average smooths price data and can help traders study the general direction of price.
Relative Strength Index (RSI)
RSI is a momentum indicator that ranges from 0 to 100. Traders commonly monitor readings around 70 and 30, although these levels should not automatically be interpreted as guaranteed reversal signals.
MACD
MACD compares moving averages and is commonly used to study momentum and possible changes in market direction.
Beginner tip: Don't cover your chart with indicators. Start with a simple chart and learn each tool properly.
A Simple Forex Chart-Reading Process
Use this checklist when studying a forex chart:
- Identify the currency pair.
- Select a timeframe.
- Identify the broader trend.
- Mark potential support and resistance.
- Study recent candlesticks.
- Check one or two indicators if needed.
- Consider the spread and trading costs.
- Define your risk before entering a trade.
Example: Reading a Hypothetical EUR/USD Chart
Imagine you're studying EUR/USD on a 4-hour chart.
You notice:
- Price has been forming higher highs.
- Pullbacks are forming higher lows.
- Price is approaching previous resistance.
- A bullish candle appears near a support area.
- RSI is above 50 but below 70.
A careful trader shouldn't automatically conclude that price will rise.
Instead, they might ask:
- Is the broader trend still intact?
- Has resistance actually broken?
- Could the move be a false breakout?
- Where would the trade idea become invalid?
- How much money could be lost?
This is an important concept: chart analysis helps create scenarios; it does not provide certainty about future prices.
Common Forex Chart-Reading Mistakes
1. Trading Every Candle
A single candle does not provide enough information to understand the entire market.
2. Using Too Many Indicators
Too many indicators can make a chart difficult to interpret.
3. Ignoring the Timeframe
A currency pair can be rising on a daily chart while falling on a shorter timeframe.
4. Ignoring Economic Events
Interest-rate decisions, inflation reports, employment data and other economic developments can cause significant price movements.
5. Using Excessive Leverage
Leverage can increase market exposure and magnify both gains and losses.
6. Moving Stop-Losses Emotionally
Changing a risk limit simply because a trade is losing can increase the potential loss.
7. Believing in Guaranteed Signals
No indicator, chart pattern or trading system can guarantee profitable trades.
Can Beginners Make Money From Forex?
Forex trading can provide opportunities, but it also carries substantial financial risk. Reading charts is only one part of trading.
A trader also needs to understand:
- Risk management
- Position sizing
- Leverage
- Trading costs
- Economic news
- Trading psychology
- Strategy testing
If you're interested in learning more about forex and potential income opportunities, read:
How to Earn Extra Money With Forex
However, forex should never be presented as guaranteed passive income.
Practice Before Risking Real Money
Beginners may want to learn how a trading platform works and practice their chart-reading skills before risking real money.
Explore Exness Trading
Affiliate disclosure: This is an affiliate link. We may receive compensation if you complete a qualifying action through this link, at no additional cost to you. Trading involves risk.
Important: Availability, account types, leverage, regulatory protections and financial products can vary by jurisdiction. U.S. readers should independently verify whether a particular broker and its services are available and appropriate for them.
Advanced Forex Education
Once you've mastered the fundamentals, you may want to study more advanced trading concepts.
Explore the Advanced Liquidity Trading Strategy Course
Affiliate disclosure: This link is an affiliate link. We may receive a commission from qualifying purchases or actions at no additional cost to you.
Forex Chart-Reading Checklist
- ☐ What currency pair am I analyzing?
- ☐ What timeframe am I using?
- ☐ Is the market trending or ranging?
- ☐ Where are recent highs and lows?
- ☐ Where are potential support and resistance levels?
- ☐ What are recent candles showing?
- ☐ Am I using too many indicators?
- ☐ What is the spread?
- ☐ Where would my trade idea be invalidated?
- ☐ How much could I lose?
- ☐ Are important economic events approaching?
Frequently Asked Questions
What is the easiest forex chart for beginners?
A candlestick chart is a good starting point because each candle shows the open, high, low and close for the selected period.
What timeframe is best for forex beginners?
There is no universally best timeframe. Many beginners find 1-hour, 4-hour and daily charts easier to study than very short-term charts.
How do I identify a forex uptrend?
An uptrend generally contains a series of higher highs and higher lows over the relevant timeframe.
What does a bearish candle mean?
A bearish candle generally means the closing price was lower than the opening price during the selected period.
What does a bullish candle mean?
A bullish candle generally means the closing price was higher than the opening price.
Can candlestick patterns predict forex prices?
No. Candlestick patterns can help traders analyze historical price behavior, but they cannot guarantee what price will do next.
Should beginners use RSI?
RSI can be useful for learning about momentum, but beginners should first understand basic price movement, trends and support and resistance.
Final Thoughts
Learning how to read a forex trading chart doesn't require memorizing dozens of patterns.
Start with the basics:
Currency pair → Timeframe → Candlesticks → Trend → Support/Resistance → Indicators → Risk Management
As you gain experience, you can gradually study more advanced technical-analysis concepts.
Most importantly, remember that a forex chart is a tool for analyzing possibilities, not a way to predict the future with certainty.
Affiliate & Advertising Disclosure
This article may contain affiliate links. We may receive a commission if you take certain actions through affiliate links, at no additional cost to you.
Affiliate relationships do not guarantee positive results. Always conduct your own research before purchasing a product, opening a trading account or risking money.
Financial Risk Disclosure: Forex and leveraged trading involve significant risk. Past performance does not guarantee future results.

Comments
Post a Comment